- Published on
Agentic Root Cause Analysis in Manufacturing
- Authors

- Name
- Oden Engineering Team
- @odentech

- Name
- Joe Youssouf
- @JYoussouf
Oden's mission is to bring every factory to the physical limits of human innovation. We get there by giving process engineers the tools and agents to unify their factory's data, make sense of it, and act on it.
That work runs on high-frequency manufacturing data: equipment temperatures, speeds, pressures, counters, quality measurements, and thousands of other signals that describe what is happening on a production line.
With an abundance of data, it is a common goal to answer the following question:
Why did a critical failure happen, and what could we have seen before it happened?
For many production problems, the answer cannot be solved by a single sensor, threshold, or model. A sudden breakage, jam, quality defect, or catastrophic downtime event is often the visible end of a multi-step chain. A speed change creates a buffer imbalance, a temperature moves out of range, tension drifts across the web, and a downstream station becomes unstable.
Manufacturers have been chasing these answers for over a century. Formal root cause analysis (RCA) took shape in the early twentieth century: identify the problem, gather the evidence, analyze it, and correct it so the failure does not recur. Adoption spread through the decades, from fault tree analysis in 1960s aerospace to the fishbone diagrams of Japanese quality circles and, most famously, the 5 Whys that Toyota popularized in the 1970s.
These investigations are not without their issues. They depend deeply on human expertise and they were never designed for the data volume a connected plant produces today. RCA in industry 4.0 aims to make the most of that vast amount of data, pointing machine learning at the data and training complex models to predict failures before they happen. Oden has been applying this approach at numerous manufacturing sites, and machine learning certainly has a place in the toolkit, but it's not the whole answer.
Most specifically, machine learning tends to fall short for rare, high-cost events with too few examples to train on. On the implementation side, mapping predictions to physical operating procedures is often overlooked or difficult to map to probabilistic responses.
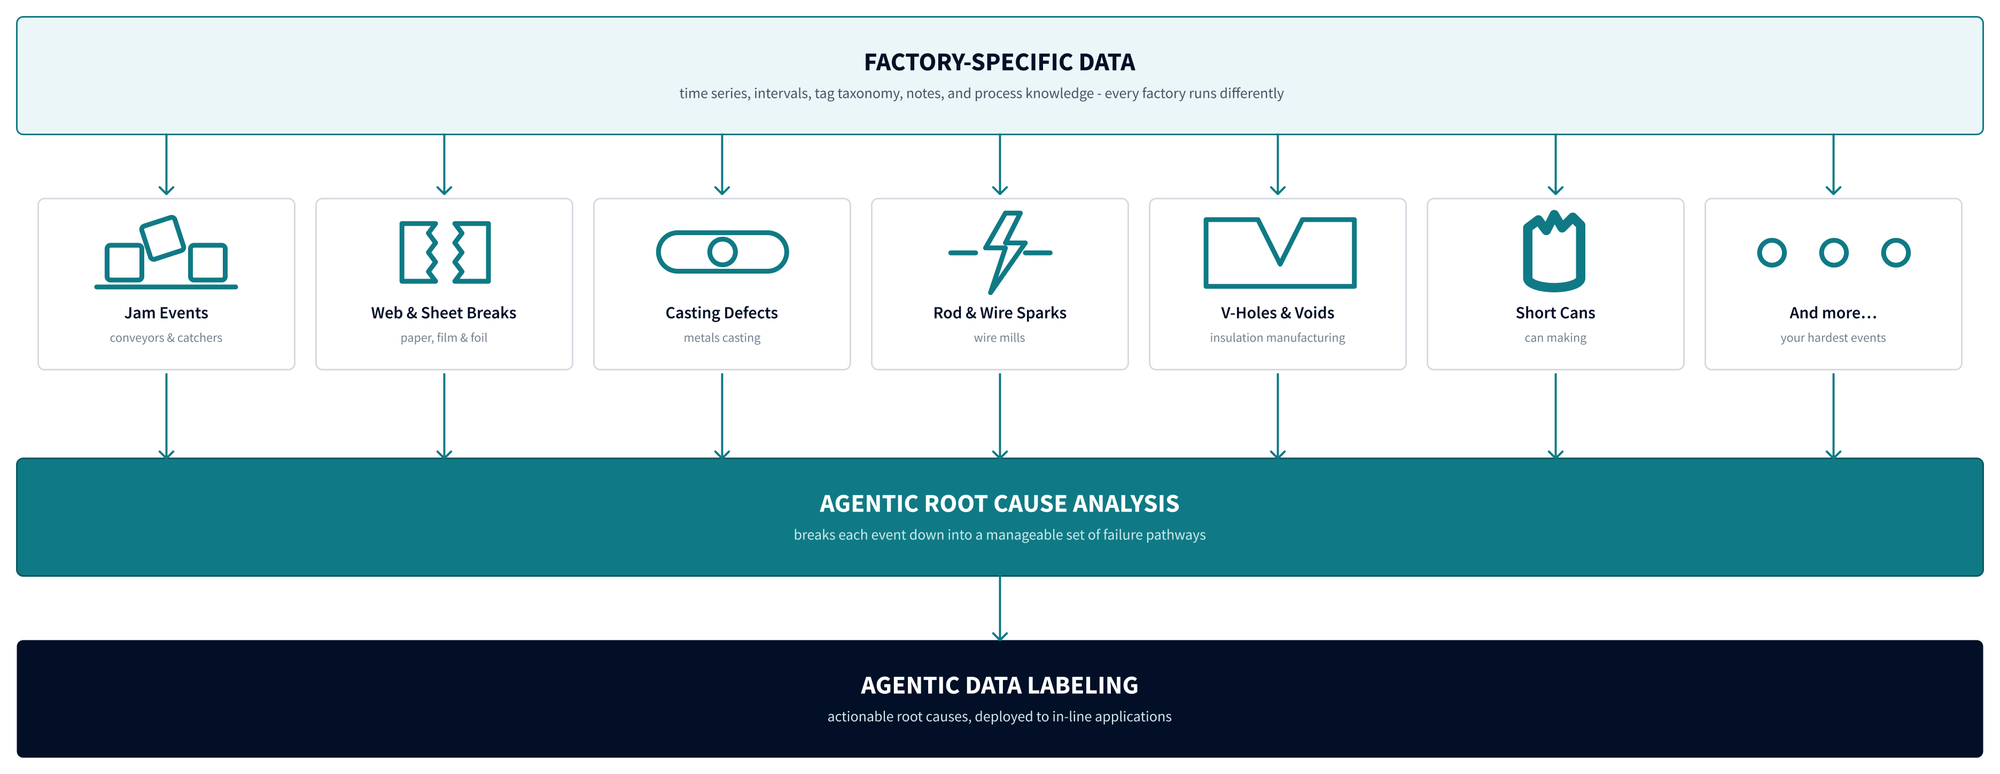
These are the events we're talking about - infrequent, expensive, and notoriously hard to explain. Each of these is really a family of failure pathways.
Given these limitations, Oden Technologies introduces agentic root cause analysis, which combines the strengths of both. It pairs frontier AI reasoning with traditional machine learning, factory-specific domain knowledge, and structured hypothesis testing to identify actionable precursors to manufacturing events.
The goal of agentic RCA is to break major issues down into a manageable set of root causes an operator can watch, understand, and act on. This post walks through the framework, where it works best, and how results get operationalized on the production line.
Agentic Root Cause Analysis
The broader framework can be summarized as five layers, which will be outlined in this post:
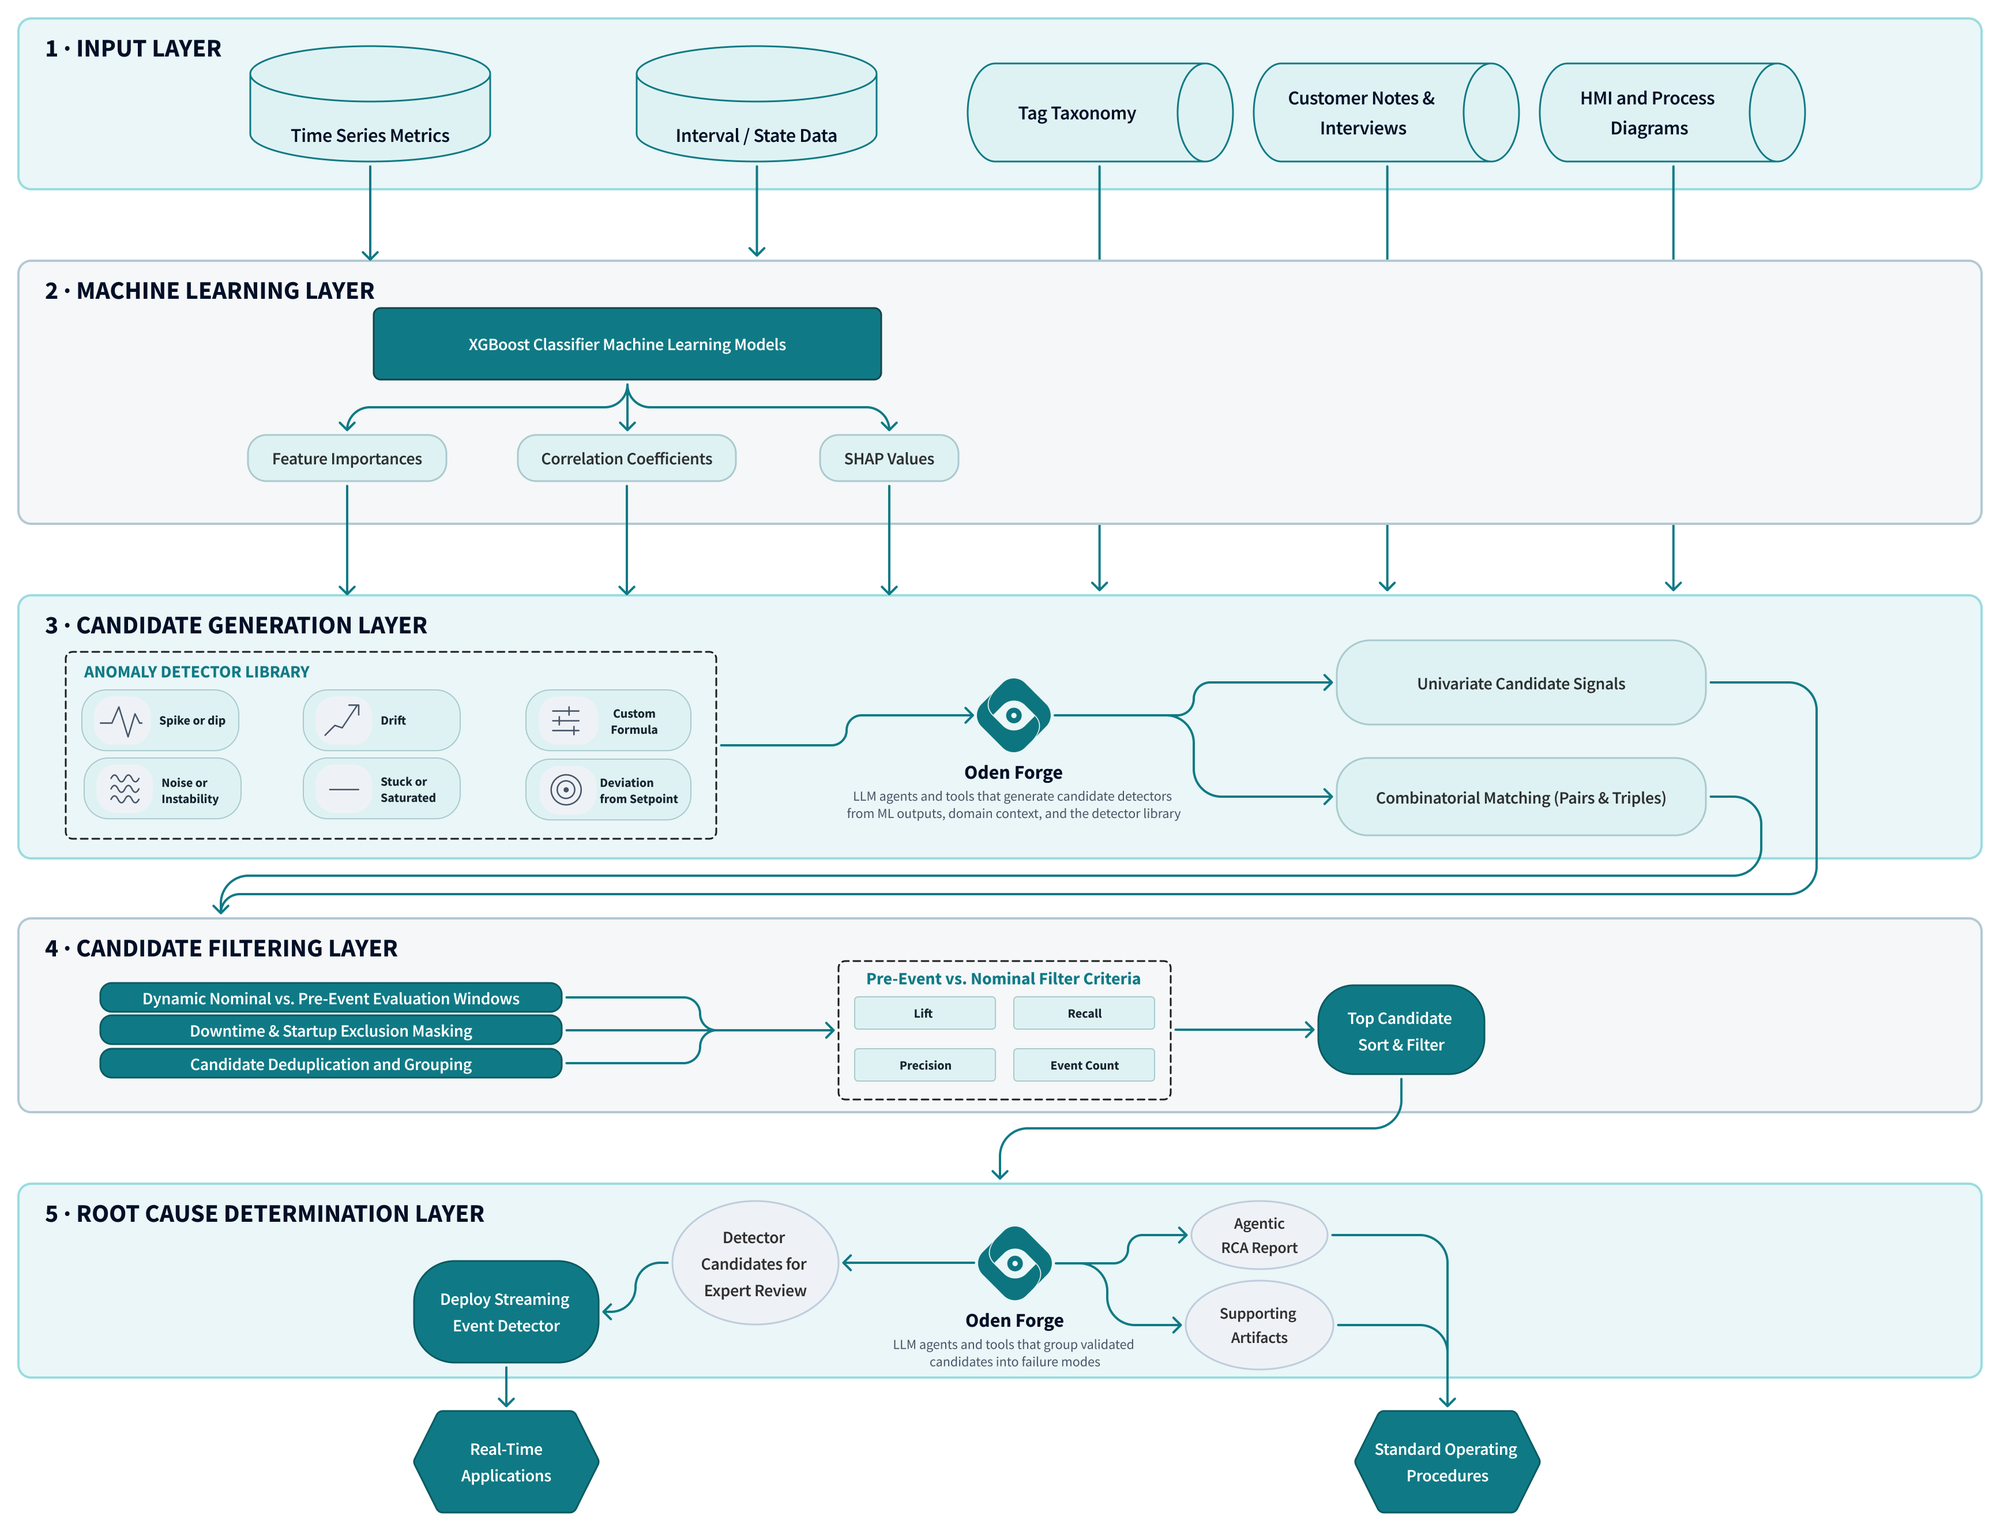
In short, the framework maps the process context, trains models to reduce the search space, generates physical hypotheses, tests signal lift statistically, and converts detectors into actionable workflows.
Layer 1: Build the operating context
Let's talk scalability. Oden supports a variety of manufacturing processes from wire and cable to insulation to can making, and our team of data scientists cannot possess in-depth domain knowledge for each and every process (although, we often start to acquire it by osmosis anyway, ask me about canmaking!). To counter this, operating context and domain knowledge must be accumulated systematically with an agentic framework front of mind. Each site provides operating context in the form of line diagrams, parameter mappings and descriptions, and process knowledge. On top of that, we interview operators, plant managers, and others who carry deep institutional knowledge. With modern day OCR parsing and LLMs, multimodal context can be aggregated in ways not possible even a few years ago.
Context is critical, as plant data is rarely self-explanatory, and specific factory knowledge is needed to tailor pre-existing frontier LLM understanding to the problems relevant for our users. A metric name might say speed, temperature, tension, or pressure, but not where that signal sits in the process or what physical mechanism it reflects. And it certainly doesn't capture the plant supervisor's gut theories:
Every time we push the speed up while the back end is still running hot, we pay for it an hour later.
Oden connects that entire knowledge domain in one place, linked directly to the raw and live data, with every new experiment, interview, or maintenance event attached as it happens. We built that foundation so our internal LLM tooling, Oden Forge, could answer everyday plant questions with real context. Domain Specific LLMs have been a hot topic in the last year, and Forge has been extremely useful for solving factory-specific problems at scale.
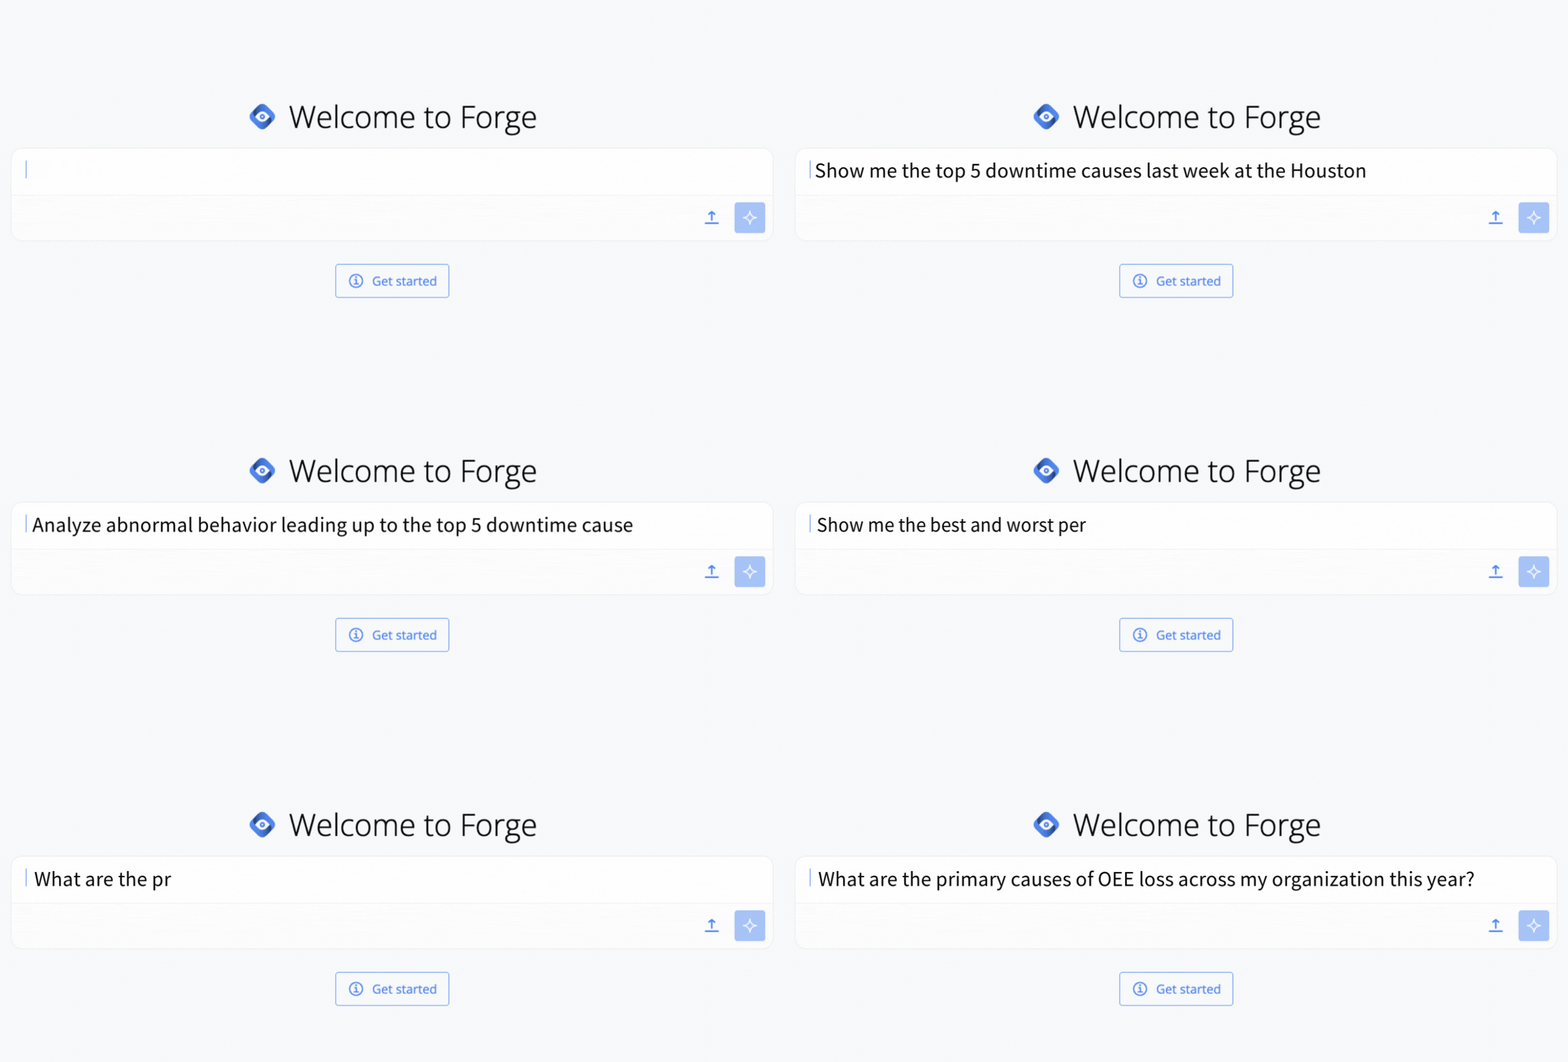
Oden Forge answering plant-specific questions, with the factory's full operating context behind it
Pushing that further, it turns out that aggregating this domain context layer is remarkably useful at a bigger job: generating hypotheses and statistical candidates for root cause analysis.
When generating candidates, the LLM works through questions like:
- Which upstream process conditions could set the stage for this event?
- Which downstream mechanical behaviors would show the earliest symptoms?
- Which metrics are cumulative counters rather than live physical readings?
- Which areas of the line can plausibly affect the location where the event shows up?
- Which signals are really the same physical mechanism, seen from different sides of the line?
Layer 2: Machine learning - reduce the search space
There are often hundreds of streaming parameters to work with. To reduce the candidate search space, we start with gradient-boosted classifiers (XGBoost). The purpose is not to deploy models with a final production alarm. It is to let each line's own historical data point us toward the signals worth investigating.
The setup
The approach generalizes to almost any discrete event. We aggregate plant and line metrics onto a common timeline, then train models to predict whether the target event will occur within a configurable lookahead horizon, tuning across horizons with traditional cross-validation. With a twenty-minute horizon, each row describes the plant state twenty minutes before a potential event. Shorter horizons capture immediate precursors; longer horizons capture the earlier, slower-building ones. Methods like catch22 or hctsa can decompose these lookback windows into shape-based descriptive features, though simple mean aggregates often yield consistent enough results.
We guard against label leakage and evaluate on held-out recent weeks, so a model can never score by peeking at the future.
This layer of classification models organizes the signal space, yielding a ranked list of feature importances, correlation scores, and SHAP values. But when the target is a high-cost event that occurs at low frequency, these models rarely reach production-grade precision and recall.
The case against machine learning in manufacturing
There is a deeper problem than precision, though, and that is brittleness.
- The line keeps changing. With every standard operating procedure (SOP) change, even a shift in personnel, your line is a little different than it was before.
- The data fragments. At plants with high product SKU counts, an already limited training set divides across products, and each product has its own unique process conditions.
- Some causes never reach the data. Shims, sudden wear, chipped tooling, and other small changes are immeasurable or cost-prohibitive to instrument, putting a baseline limit on what any model can see.
- History expires. Every maintenance event turns the line into a slightly different version of itself. It is unnoticeable day to day, but from a machine learning perspective it stamps an expiration date on your time series. Enough upgrades and you are in a ship of Theseus scenario, no longer operating the line you trained on.
Interpretability is just as difficult in a single model. SHAP tells us which features matter, but even those are imperfect estimations: many parameters can change significantly and earn high SHAP values without being causally related to the event.
What operators need instead is a set of verified failure conditions, monitored in real time and surfaced while they work. The best operators keep eyes on hundreds of cues in a single shift; new operators take years to build that muscle memory. Our systems should encode that vigilance directly, as deterministic, verified conditions tied to the biggest problems on the line and raised the moment they occur.
Supervised modeling is not the end product, but it is an excellent first-pass search. The signals that appear repeatedly in feature importance and SHAP analysis become the inputs to the next layer, candidate generation.
Layer 3: Candidate generation - hypothesize failure pathways
An agentic workflow then converts those statistical candidates into testable physical stories. A useful hypothesis ties a signal pattern to a plausible physical mechanism, and, critically, to a specific statistic that can be tested against the data. A generated hypothesis might read:
Upstream acceleration gives the cooling section less time to adapt, so exit temperature climbs in the minutes before a stoppage.
Candidate: mean cooling exit temperature over the 15 minutes before each event, versus nominal running.
The physical story is what makes a candidate explainable; the test statistic is what makes it falsifiable. The agent produces both autonomously, and with current frontier models the reasoning is generally accurate and genuinely insightful. When it does hallucinate, the mistake does not survive the next layer, because every hypothesis must earn its place statistically.
Layer 4: Candidate filtering - test with lift analysis
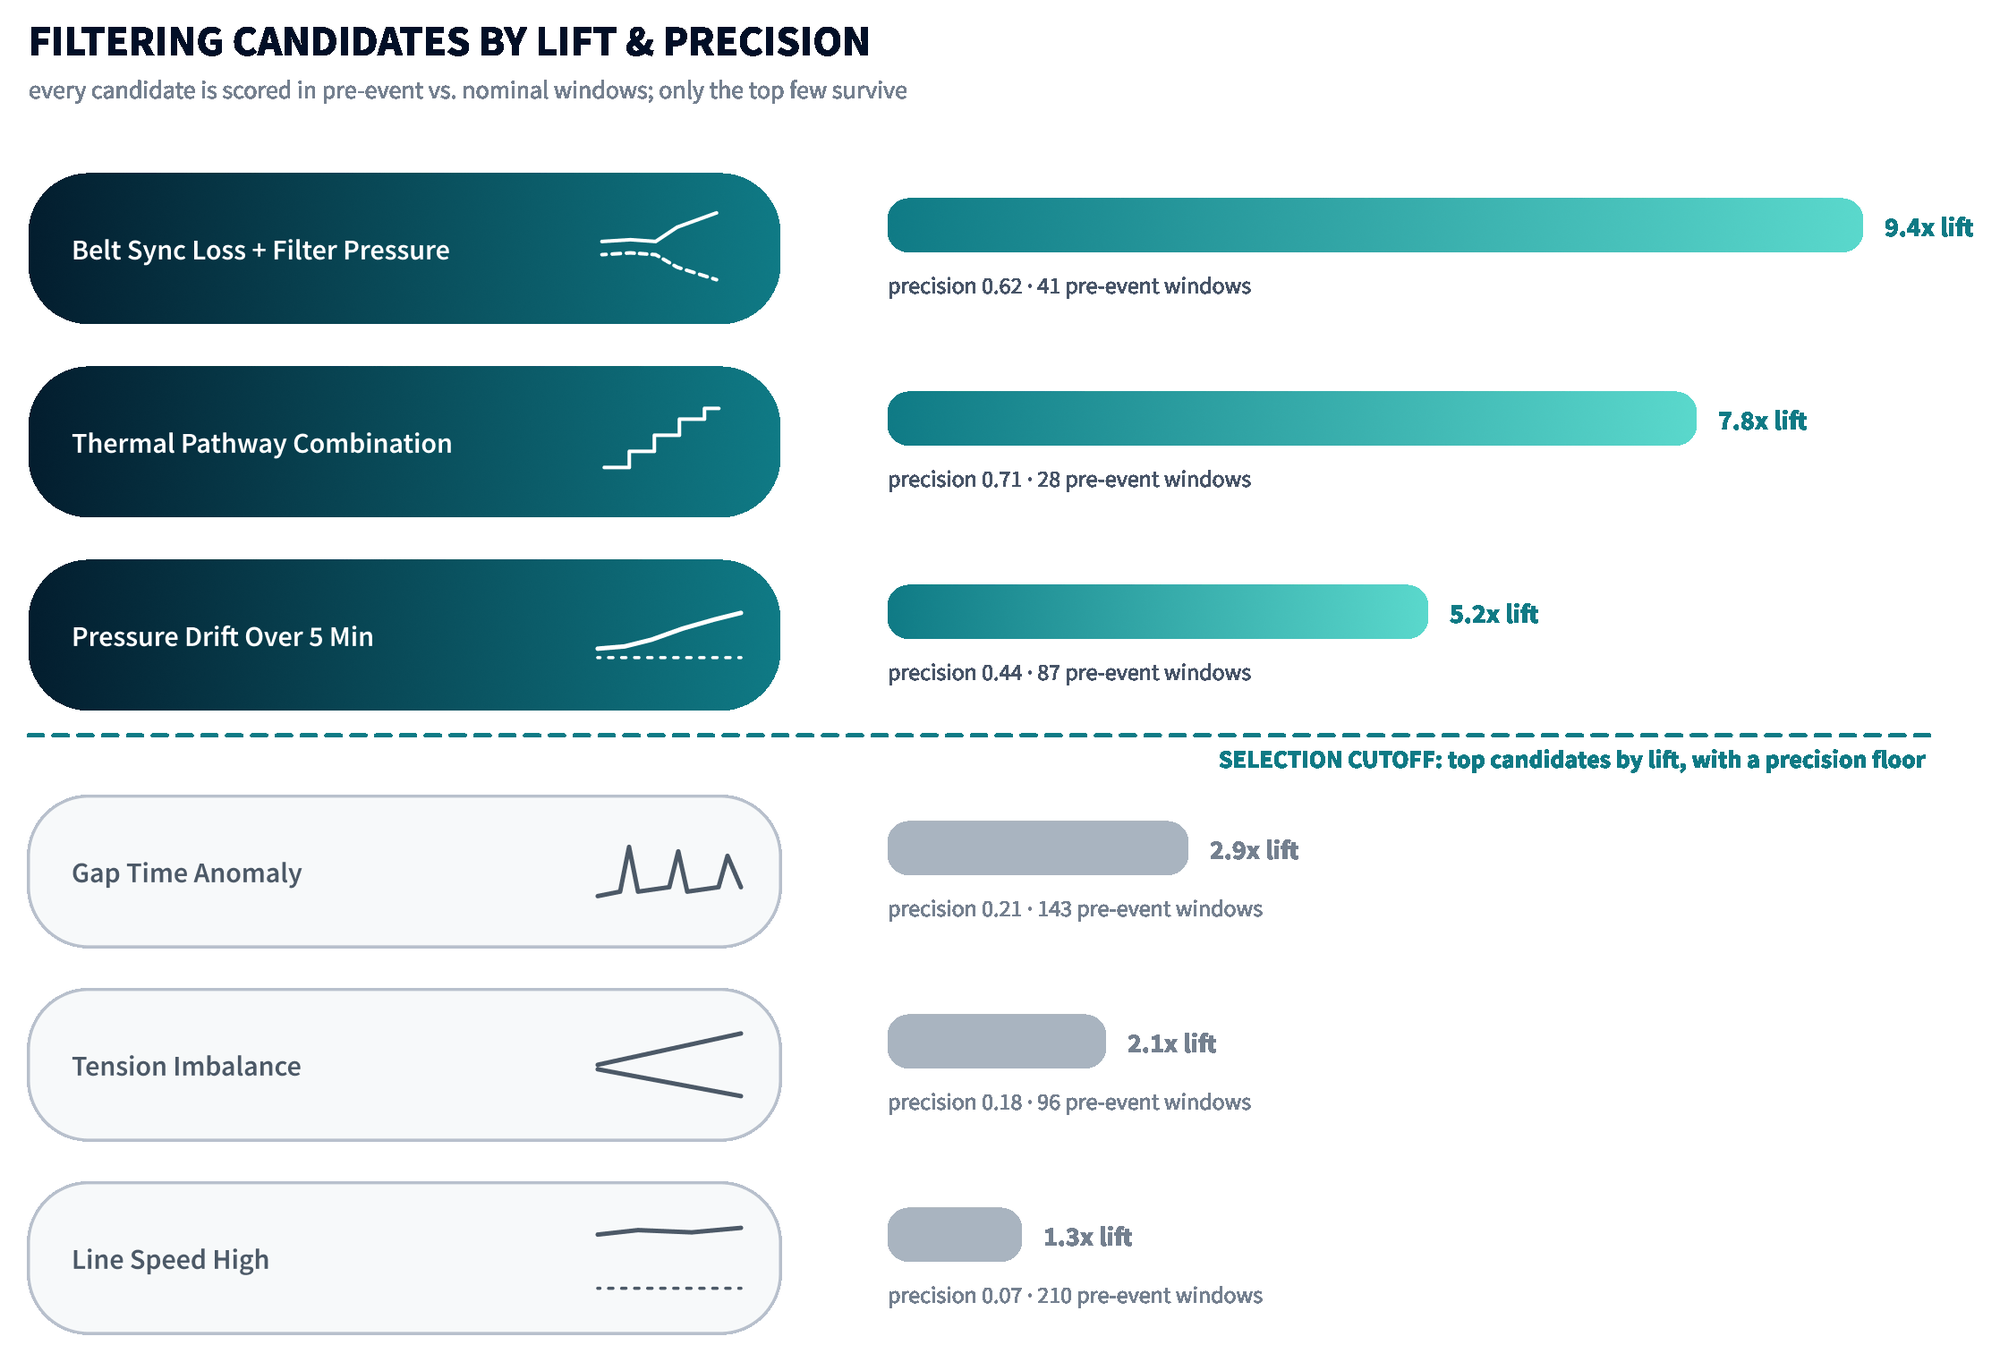
Each candidate is then passed through the same rigorous filtering layer. We seek to answer "how much more likely is a signal to fire in the pre-event window than during normal operation?"
For each candidate - a single signal, or a multi-signal combination when the model deems one physically plausible - we compare its firing rate before events against its background rate, and measure precision alongside lift.
Statistical guardrails
Guardrails are the requirements every candidate must adhere to before its score can be trusted:
- Dynamic evaluation windows compare pre-event behavior against true nominal running, not against the whole tape.
- Downtime and startup masking keeps shutdown artifacts from ever scoring.
- Permutation testing against thousands of random nominal windows rules out chance-level firing.
The output is a ranked shortlist, with every candidate scored and only the strongest kept. The survivors are rarely one kind of detector: some are broad early warnings, others are narrow high-confidence signals, and both have a role to play.
The guardrails are extensible, too. Users can add new rules with plain natural-language instructions, through Forge's chat interface.
Layer 5: Root cause determination - from detectors to action
In our experience, a focused detector strategy beats a single generic event classifier. There are two deployment shapes - focused models per failure mode, or atomic detectors that fire on specific signal combinations. Atomic detectors are easier to explain, validate, connect to operator actions, and tune by line or product.
False positives are inevitable, but one way to manage them is to tag every alert with its recommended action: "inspect this alignment", "check that tracking", "review recent speed changes". This bakes in adherence scoring criteria right from the start.
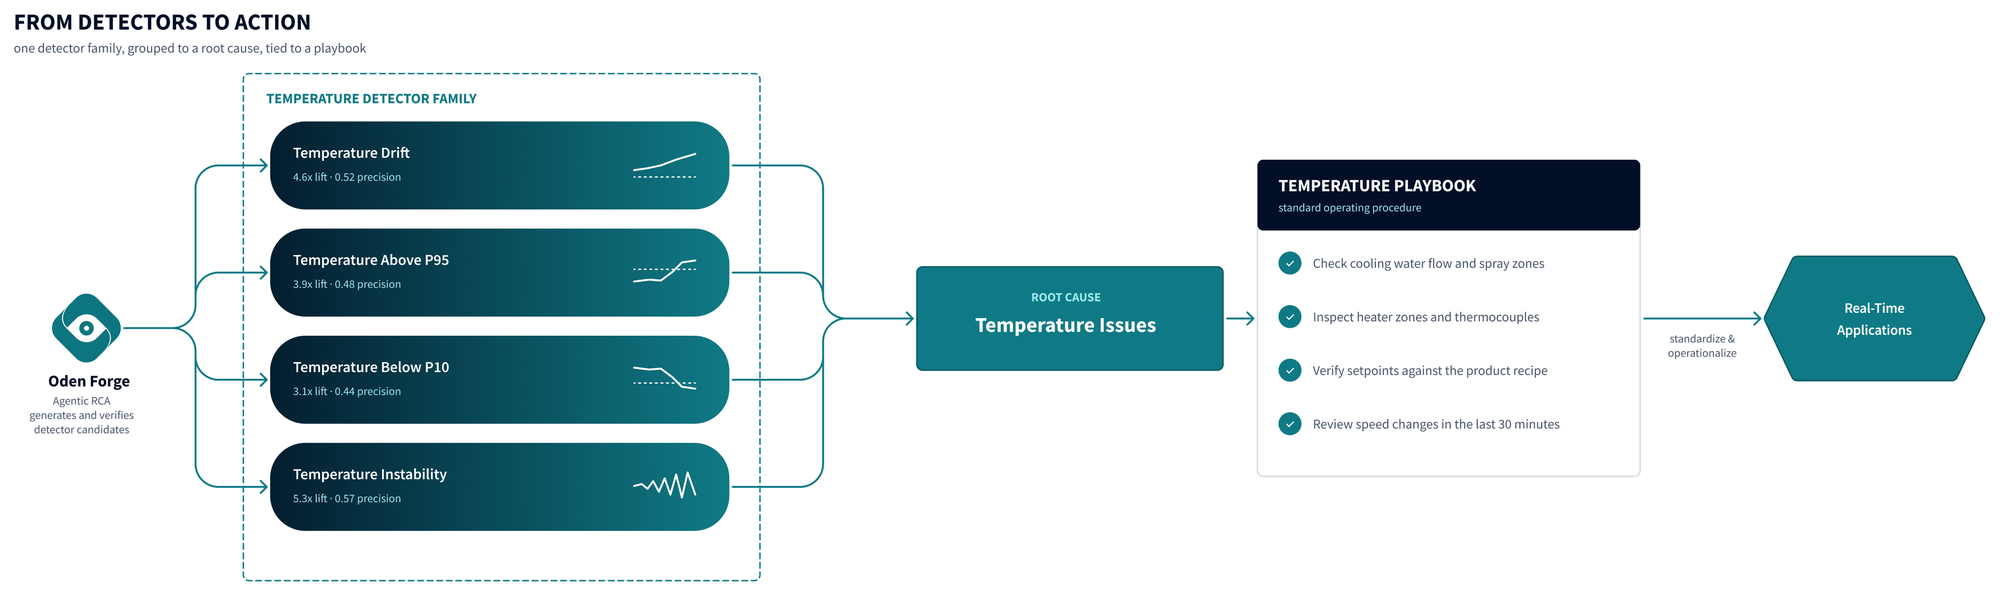
Here is what that looks like end to end for a single "family" (or root cause) of detectors. Forge generates and verifies a family of related detectors, the family groups to a single root cause, and the root cause carries a playbook that standardizes the response and feeds real-time applications.
Next steps
From here, we validate candidate detectors out of sample and repeat the analysis for other event types. Although a basic implementation was described here, here are some more advanced techniques we use to improve the quality of the final root cause detectors:
- Engineering features that better represent physical groups
- Replicating results across multiple lines or factories where an event can occur
- Implementing direct feedback buttons to tune thresholds in real-time
- Deploying validated detectors as live data labels feeding real-time, in-line applications
- Feeding confirmed root causes back into standard operating procedures
- With enough evidence, using results to drive process or equipment changes to root out an issue permanently
Conclusion
The biggest issues in manufacturing are rarely solved by a single standardized model pipeline or dashboard. Individual machine learning models are brittle on a line that never stops changing, and probabilistic multi-input models are hard to trust or decipher action from.
Agentic RCA layers humanity's best tools instead: machine learning to reduce the search space, domain knowledge to generate hypotheses, statistics to test them, and deterministic detectors that operators can understand and act on.
Today, plants produce more data than ever, a generation of hard-won expertise is heading into retirement, and production problems continue to get more complex.
We are building with the expectation that frontier models will keep improving, and we are fully focused on making sure manufacturing captures that progress.